
Find The Cause of A Bug Faster With These 3 Chrome Tips

I have come to a conclusion that many debugging methods and tools haven't reached a broad audience. Perhaps we consider reading a blog post or watching a video about a browser's developer tools uninteresting or unimportant, yet developers spend a great deal of time debugging layout and JavaScript issues. In this blog, I'll share a few tips on debugging I have learned during my career.
Get a complex object literal from the browser
The response from a third party API can contain hundreds of rows, each containing an object literal with dozens of properties. When trying to figure out what is wrong with the dataset, the data visualization on the developer's toolbar console can begin to feel limiting.
The following screen capture shows a browser dataset that I want. I can get the value of the most recently evaluated expression with Chrome DevTools console command $_. The copy console command copies the value to the clipboard.
Now I can paste the entire object literal to, for example, a text editor.
To understand the structure a little better, convert the object literal to a JSON string and paste it into one of the many JSON visualizers.
copy(JSON.stringify(your_data))
I can convert an object literal to a JSON string with JSON.stringify, then copy the string to the clipboard with copy. I tried to figure out whether data is sent back to the server, but it is better to be safe than sorry, so don't send sensitive data to the online version of visualizers.
Which JavaScript function is causing unexpected changes to the DOM?
It is hard to say what causes the DOM to be in an unexpected state, especially when working with legacy JavaScript projects in which JavaScript and jQuery have been used thoughtlessly.
Let's assume that a class was wrongly added to a DOM element. The typical initial reaction is to search the source code, using the class name as a keyword. For a keyword like active, a large code base would return too many occurrences.
DOM breakpoints to the rescue.
Inspecting an element brings up a context menu option called "Break on..." Of the few items on its submenu, we want to select Attributes Modifications because the class is a DOM element attribute.
When the DOM element attribute changes, execution of JavaScript halts and the problem can be investigated. If the DOM has been abstracted over, such as with jQuery, JavaScript execution in the jQuery source code halts because jQuery adds the class. The call stack can be used to identify source code that changed the DOM element class attribute with jQuery.
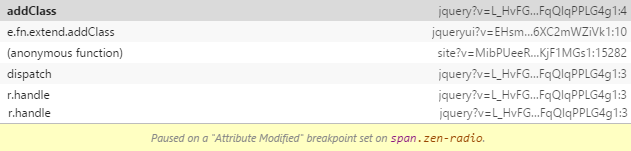
In the case of the anonymous function represents our source code, and checking that line leads would most likely reveal the cause for the incorrect UI logic.
Inspecting a DOM element using Chrome DevTools console
Most developers know that they can use Inspect Element to view an element's DOM. This can be done after opening Chrome DevTools and then Ctrl + Shift + I will allow clicking an element and it will be selected in the Elements tab. After selecting the element, however, we can go deeper.
Writing $0 to the console provides code access to the DOM element most recently accessed from the Chrome Developer Tools Elements tab.
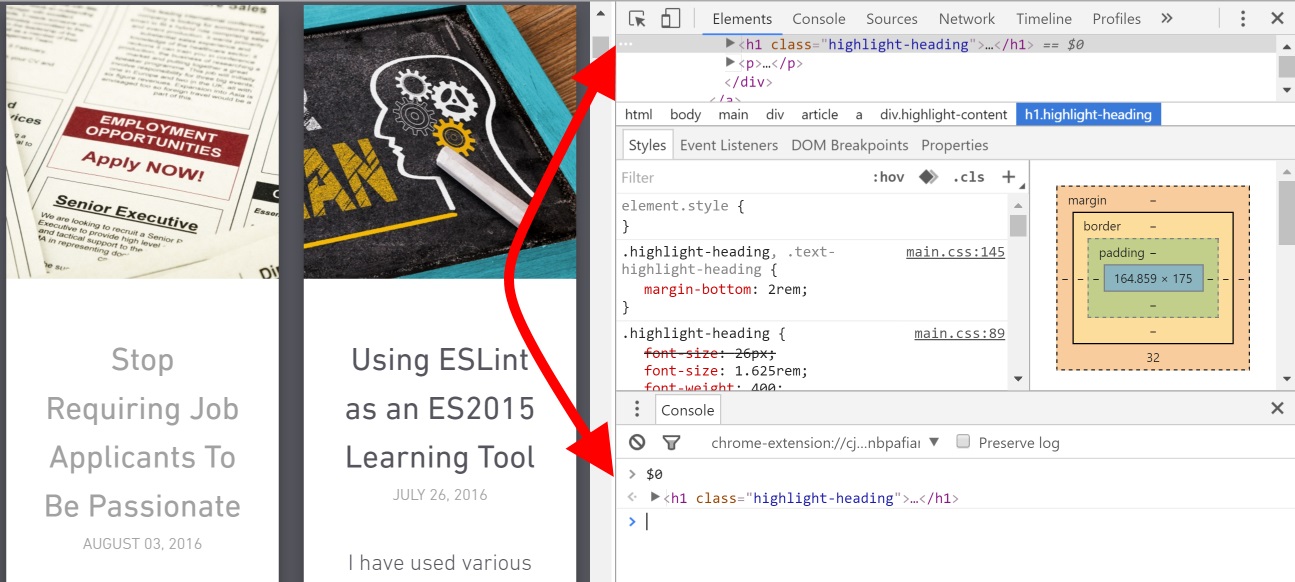
To convert this code to a jQuery instance, add a native DOM element to the jQuery call.
$($0)
You can also use $1 to $4 to access the second, third, and fourth most recent items, respectively, in the Element selection history.
Why is this useful? Why isn't the Elements tab enough?
There are several reasons:
- you're able to call function with the DOM element as an argument
- trying to check data that the Elements tab doesn't show, such as data attributes and input values
Accessing the DOM element programmatically could be very troublesome. In the simplest scenario, the element would have an Id attribute that you can access using document.getElementById('your_element_id').
If you want to learn more about other console commands, read Interact from Command Line from the Chrome DevTools documentation.
Conclusion
In this blog post, I shared a few tips for quickly solving common issues with Chrome DevTools. Some of the tips also apply to other browser vendors, so be sure to check their documentation. There are also plenty of helpful extensions that I have found useful, such as Redux DevTools and React Developer Tools. They are worthy of their own blog posts.
I would like to hear your tips and experiences with debugging client-side problems!